Products in stock in the United States can be delivered within 2 days.
 +1-2404726069 (U.S.) +86-027-65528241 (Outside U.S.)
  overseas@yeasen.com
 0
0G418 Sulfate (Geneticin)

Product Description
In mammalian cells, neo encodes the expression of amino-glycoside 3' -phosphotransferase (APH (3') II) after being integrated into the eukaryotic genome. This enzyme inactivates the antibiotic by covalently modifying the amino or hydroxyl function of G418 and inhibiting the antibiotic-ribosome interaction, endowing the cell with G418 resistance. In screening stable cell line experiments, the killing curves (dose-response curves) should be established to determine the minimum effective concentration for killing non-resistant cells.
In plant cells, resistance can be obtained by transfection of nptII gene-resistant plasmid. The nptII gene also encodes aminoglycoside phosphotransferase, an enzyme that inactivates several antibiotics, including G418, kanamycin, and palomycin.
Product Properties
|
Synonym |
G-418 disulfate; Geneticin sulfate; Antibiotic G418; G 418 Sulfate; Antibiotic G-418 sulfate |
|
CAS No. |
108321-42-2 |
|
Molecular formula |
C20H40N4O10·2 H2SO4 |
|
Molecular weight |
692.7 g/mol |
|
Appearance |
White or light white powder |
|
Purity |
≥98% |
|
Potency(anhydrous) |
>700 U/mg |
|
Solubility |
≥60 mg/mL in H2O; insoluble in EtOH; insoluble in DMSO |
|
Structure |
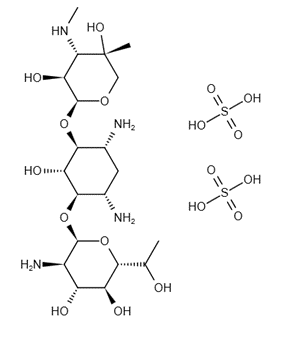 |
Shipping and Storage
The product is shipped with ice pack and can be stored at -20℃ for 3 years.
Avoid moisture, which can reduce antibiotic activity.
Cautions
1. This product can not be autoclave.
2. G418 can not be used with other antibiotics/antifungals (e.g. penicillin/streptomycin) as they are competitive inhibitors of G418. Other antibiotics potentially cross-reactive as well.
3. When preparing G418 solution, it is necessary to make conversion based on different potency values of Batch G418, so as to obtain storage solution and working solution requiring activity concentration.
4. When G418 is added into the culture system, the untransfected cells may not be killed, possibly because the concentration is too low or the cell density is too high. In addition, cells that divide quickly are more likely to be killed than cells that multiply slowly.
5. Even with the addition of the killing dose of G418, cells may continue to divide 2-3 times. The effects of G418 usually take two days to become apparent.
6. For your safety and health, please wear lab coats and disposable gloves for operation.
7. For research use only!
Instructions
1. Preparation of G418 storage solution (50 mg/mL, active concentration)
1) Conversion of activity units
The conversion was performed according to this formula: (1000/A0) ×A1=A2
A0: Potency value of G418, which varies from batch to batch. See the batch quality report or label on the bottle.
A1: The concentration of active G418 you desire.
A2: The actual concentration of G418.
For example, if the G418 activity value of the batch is 750 U/mg and the active concentration of G418 is 50 mg/mL, the actual powder concentration to be prepared is 1000/750×50 mg/mL=66.33 mg/mL.
If 10 mL of G418 storage solution (active concentration, 50 mg/mL) is prepared, 663.3 mg of powder should be weighed.
2) Sterilization and preservation
Weigh the actual powder obtained by the above conversion and add 10 mL of sterile deionized water to dissolve it completely.
Pre-wet 0.22 μm needle filter with 5 mL of sterile deionized water, and then sterilize the G418 solution by filtration. Aliquot the sterilized G418 solution and store it at -20℃.
[Note]: ① Do not filter the cloudy solution, as the solution has not completely dissolved, the filtration process will cause drug loss, and reduce the activity of the final solution. ② It is not recommended to use culture media, phosphate solutions or organic solvents to prepare the storage solution.
2. Commonly used screening concentration
In general, a high concentration of G418 is required initially for screening transformers, and use a low concentration to maintain culture. Growth conditions, cell types, and other environmental factors may affect the effective dosage of G418, so it is recommended to determine the optimal screening concentration through the killing curve (dose-response curve).
Generally, the screening range of mammalian cells is 200-2000 μg/mL, Plant cell: 10-100 μg/mL, Yeast cell: 500-1000 μg/mL.
Cell Line Experimental Data
|
cell type |
Activate the concentration |
Application |
References |
|
Dictyostelium |
a) 10 μg/mL |
a) Culture in medium b) Culture on lyophilized bacteria |
Hirth, et. al., Proc. Natl. Acad. Sci., v. 79, 7356-7360 (1982). |
|
Mammal Species |
a) 400 -1000 μg/mL |
a) Used for screening b) Used for maintenance |
Canaani and Berg, Proc. Natl. Acad. Sci., v. 79, 5166-5170 (1982). |
|
Plant |
a) 25-50 μg/mL |
a) Used for screening b) Used for maintenance |
Ursic, et. al., Biochem. Biophys. Res. Comm., v. 101:3, 1031-1037 (1981). |
|
Yeast |
a) 500 μg/mL b) 125-200 μg/mL |
a) Used for screening b) Used for maintenance |
Jimenez and Davies, Nature, v. 287, 869-871 (1980). |
|
Bacteria |
16 μg/mL |
Used for screening |
Waitz, et. al., Antimicrob. Agents Chemother., v. 6:5, 579-581 (1974). |
3. Establishment of the killing curve
[Note]: In order to screen for cell lines with stable expression of target proteins, it is necessary to determine the minimum concentration of antibiotics that can kill untransfected host cells. This can be achieved by establishing a killing curve (dose-response curve). At least six concentrations should be selected. G418 is most active when treating the mitotic cell, so cells need to be cultured for a period of time before adding G418.
1) Day 1: Untransformed cells are placed on an appropriate culture plate with a cell density of 20-25% at 37℃ and cultured overnight in CO2;
[Note]: For cells requiring higher density to detect viability, the amount of inoculation can be increased.
2) Set the G418 concentration gradient within the appropriate range according to the cell type. Mammalian cells can be set at 0, 50, 100, 200, 400, 800, 1000 μg/mL.
3) Day 2: Remove the old medium and replace it with a freshly prepared medium containing the corresponding concentration of drugs. Make three parallels for each concentration.
4) Then replace with fresh media containing G418 every 3-4 days.
5) Live cell counts are performed at a fixed cycle (e.g., every 2 days) to determine the appropriate concentration. Choose the minimum concentration, which kills the majority of cells within an ideal number of days (usually 7-10 days), as the working concentration for stable transfection cell screening.
4. Screening of stably transfected cells
1) 48 h after transfection, G418 culture medium containing appropriate concentration was used for a subculture (direct subculture or diluted subculture).
[Note]: In order to obtain good screening results, it is recommended to dilute the cells with no more than 25% abundance.
2) Change the screening medium containing drugs every 3-4 days.
3) Measure the cell colony formation after 7 days of screening. Colony formation may take another week or more, depending on host cell type, transfection, and screening effectiveness.
4) 5-10 resistant clones were selected and transferred to 35 mm cell culture plates, and cultured with a drug-containing screening medium for 7 days.
5) Replace with normal medium.

[1] Zhu G, Xie J, Kong W, et al. Phase Separation of Disease-Associated SHP2 Mutants Underlies MAPK Hyperactivation. Cell. 2020;183(2):490-502.e18. doi:10.1016/j.cell.2020.09.002(IF:38.637)
[2] Zhang D, Liu Y, Zhu Y, et al. A non-canonical cGAS-STING-PERK pathway facilitates the translational program critical for senescence and organ fibrosis. Nat Cell Biol. 2022;24(5):766-782. doi:10.1038/s41556-022-00894-z(IF:28.824)
[3] Zhou C, Yi C, Yi Y, et al. LncRNA PVT1 promotes gemcitabine resistance of pancreatic cancer via activating Wnt/β-catenin and autophagy pathway through modulating the miR-619-5p/Pygo2 and miR-619-5p/ATG14 axes. Mol Cancer. 2020;19(1):118. Published 2020 Jul 29. doi:10.1186/s12943-020-01237-y(IF:27.401)
[4] Meng F, Yu Z, Zhang D, et al. Induced phase separation of mutant NF2 imprisons the cGAS-STING machinery to abrogate antitumor immunity. Mol Cell. 2021;81(20):4147-4164.e7. doi:10.1016/j.molcel.2021.07.040(IF:17.970)
[5] Zhou C, Liang Y, Zhou L, et al. TSPAN1 promotes autophagy flux and mediates cooperation between WNT-CTNNB1 signaling and autophagy via the MIR454-FAM83A-TSPAN1 axis in pancreatic cancer. Autophagy. 2021;17(10):3175-3195. doi:10.1080/15548627.2020.1826689(IF:16.016)
[6] Chen S, Liu S, Wang J, et al. TBK1-Mediated DRP1 Targeting Confers Nucleic Acid Sensing to Reprogram Mitochondrial Dynamics and Physiology. Mol Cell. 2020;80(5):810-827.e7. doi:10.1016/j.molcel.2020.10.018(IF:15.584)
[7] Zhao Q, Zheng K, Ma C, et al. PTPS Facilitates Compartmentalized LTBP1 S-Nitrosylation and Promotes Tumor Growth under Hypoxia. Mol Cell. 2020;77(1):95-107.e5. doi:10.1016/j.molcel.2019.09.018(IF:14.548)
[8] Yu P, Zhu X, Zhu JL, et al. The Chk2-PKM2 axis promotes metabolic control of vasculogenic mimicry formation in p53-mutated triple-negative breast cancer. Oncogene. 2021;40(34):5262-5274. doi:10.1038/s41388-021-01933-z(IF:9.867)
[9] Wu Y, Gu W, Han X, Jin Z. LncRNA PVT1 promotes the progression of ovarian cancer by activating TGF-β pathway via miR-148a-3p/AGO1 axis. J Cell Mol Med. 2021;25(17):8229-8243. doi:10.1111/jcmm.16700(IF:5.310)
[10] Zeng WJ, Lu C, Shi Y, et al. Initiation of stress granule assembly by rapid clustering of IGF2BP proteins upon osmotic shock. Biochim Biophys Acta Mol Cell Res. 2020;1867(10):118795. doi:10.1016/j.bbamcr.2020.118795(IF:4.105)
[11] Li B, Zhang J, Su Y, et al. Overexpression of PTEN may increase the effect of pemetrexed on A549 cells via inhibition of the PI3K/AKT/mTOR pathway and carbohydrate metabolism. Mol Med Rep. 2019;20(4):3793-3801. doi:10.3892/mmr.2019.10617(IF:1.851)
Catalog No.:*
Name*
phone Number:*
Lot:*
Email*
Country:*
Company/Institute:*
